Welcome to Shanshan Blog!
-
Quick Sort and Implementation in Python
Quick Sort
Quicksort is a divide and conquer algorithm. Quicksort first divides a large array into two smaller sub-arrays: the low elements and the high elements.
Example
Given a list [6 2 4 1 5 9]
a. pick the first number 6, and compare other numbers with 6, the bigger one is put in the right, otherwise in the lef, so it become: [2 4 1 5 6 9]
b. then quick sort the left part [2 4 1 5] and the right part [9], continue step a, it will become: [1 2 4 5], so the result is [1 2 4 5 6 9]
Complexity
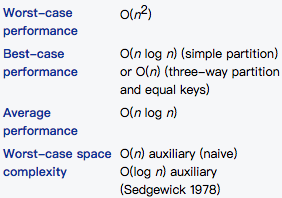
Pseudocode
algorithm quicksort(A, lo, hi) is
    if lo < hi then
        p := partition(A, lo, hi)
        quicksort(A, lo, p – 1)
        quicksort(A, p + 1, hi)

algorithm partition(A, lo, hi) is
    pivot := A[hi]
    i := lo     // place for swapping
    for j := lo to hi – 1 do
        if A[j] ≤ pivot then
            swap A[i] with A[j]
            i := i + 1
    swap A[i] with A[hi]
    return i
Implementation in Python
# -*- coding:utf-8 -*-
# 通过一趟扫描将要排序的数据分割成独立的两部分,
# 其中一部分的所有数据都比另外一部分的所有数据都要小,
# 然后再按此方法对这两部分数据分别进行快速排序,整个排序过程可以递归进行,
# 以此达到整个数据变成有序序列

def partition(l, start, end):
    middle = l[start]
    while (start < end):
        while (start<end and l[end] > middle):
            end = end-1
        l[start] = l[end]
        while (start<end and l[start] <= middle):
            start = start+1
        l[end] = l[start]
    l[start] = middle
    return start

def quick_sort(l, start, end):
    if (start < end):
        middle = partition(l, start, end)
        quick_sort(l, start, middle-1)
        quick_sort(l, middle+1, end)
    return l;

def main():
    l = [2, 3, 4, 1, 7, 3, 8, 1100, 282828, 1, 20, 0]
    li = quick_sort(l, 0, len(l) - 1)
    print li

main()
-
Machine Learning Naive Bayes
- The foundation: Probabilistic model
- Knowledgement and Process
- Constructing a classifier from the probability model
- Parameter estimation and event models
- Codes
- Multinomial Naive Bayes
Naive Bayes Algorithms
The foundation: Probabilistic model
Abstractly, naive Bayes is a conditional probability model: given a problem instance to be classified. Bayes Probability terminology:

Knowledgement and Process
The sample belongs to the type with the highest probability. The definition is:
a.
 is the features data, a means x’s every feature
b. Multiple classes:

c. Calculate conditional Probabilistic:

d. If
 , then
The point is how to calculate the step c:
c.1 Get the training set.
c.2 Calculate the conditional probability:

c.3 If features are conditional dependent, based on

Because the denominator is constant, so maximum the numerator, and features are dependent, so

Constructing a classifier from the probability model
The discussion so far has derived the independent feature model, that is, the naive Bayes probability model. The naive Bayes classifier combines this model with a decision rule. One common rule is to pick the hypothesis that is most probable; this is known as the maximum a posteriori or MAP decision rule. The corresponding classifier, a Bayes classifier, is the function that assigns a class label for some k as follows:

Parameter estimation and event models
- Gaussian Naive Bayes
The likelihood of the features is assumed to be Gaussian:

Codes
using scikit-learn package
from sklearn import datasets
iris = datasets.load_iris()
from sklearn.naive_bayes import GaussianNB

gnb = GaussianNB()
y_pred = gnb.fit(iris.data, iris.target).predict(iris.data)
print("Number of mislabeled points out of a total %d points : %d" % (iris.data.shape[0],(iris.target != y_pred).sum()))
Multinomial Naive Bayes
MultinomialNB implements the naive Bayes algorithm for multinomially distributed data, and is one of the two classic naive Bayes variants used in text classification (where the data are typically represented as word vector counts, although tf-idf vectors are also known to work well in practice).
- Bernoulli Naive Bayes
classification algorithms for data that is distributed according to multivariate Bernoulli distributions; i.e., there may be multiple features but each one is assumed to be a binary-valued (Bernoulli, boolean) variable. Therefore, this class requires samples to be represented as binary-valued feature vectors; if handed any other kind of data, a BernoulliNB instance may binarize its input (depending on the binarize parameter).
The decision rule for Bernoulli naive Bayes is based on

-
StatsModels Statistics Packages in Python with Time Series Analysis
Python Package StatsModels has the Time Series Analysis Module in tsa. Here we summary some frequently used in practice.
# -*- coding:utf-8 -*-

import pandas as pd
from statsmodels.tsa.stattools import *
import matplotlib.pylab as plt
from statsmodels.tsa import ar_model
from statsmodels.tsa.vector_ar import var_model

dateparse = lambda dates: pd.datetime.strptime(dates, '%Y-%m')
data = pd.read_csv('AirPassengers.csv', index_col='Month',date_parser=dateparse)
ts = data['#Passengers']

# 1. Descriptive Statistics and Tests
#  自协方差
autocovariance_data =   acovf(ts)
# 自回归函数--可用于确定AR的阶层
acf_data = acf(ts, nlags=40)
# 部分自相关函数 -- 可用于确定MA的阶层
pacf_data = pacf(ts, nlags=40)
# 交叉协方差,两个样本的
crosscovariance_data = ccovf(ts, ts)
# 交叉相关矩阵,两个样本
crosscorrelation_data = ccf(ts, ts)
# ADF 检验,用于检验平稳性
# 返回值为['Test Statistic', 'p-value', '#Lags Used', 'Number of Observations Used']
adf_res = adfuller(ts)
# Ljung-Box Q Statistic
qStat_data = q_stat(ts, nobs=20)


# 2. Estimation
# 单变量AR
model_AR = ar_model.AR(ts)
res_AR = model_AR.fit()
# 可查看更多内置函数
result_AR = ar_model.ARResults(model_AR, ts)
# print result_AR.aic()
# ARMA 和ARIMA用法和AR函数相似
# ARMA,且ARMA process有专门的属性函数
model_ARMA = ar_model.ARMA(ts, order=(2,2))
# ARIMA
model_ARIMA = ar_model.ARIMA(ts, order=(2,1,2))
# VAR,详情见VARexample

# 3. ARMA Process
# 4. var
# 5. VARMA Process
# Time Series Filters
To see VAR and ARIMA full details, go to the post Time Series Analysis.
-
Time Series Analysis 2 ARCH examples
# -*- coding:utf-8 -*-
# arch 模型的建立
# 步骤(1):通过检验数据的序列相关性建立一个均值方程,如有必要,对收益率序列建立一个计量经济模型(如ARMA)来消除任何线形依赖。
# 步骤(2):对均值方程的残差进行ARCH效应检验
# 步骤(3):如果具有ARCH效应,则建立波动率模型
# 步骤(4):检验拟合的模型,如有必要则进行改进
import pandas as pd
from statsmodels.tsa.stattools import adfuller
from statsmodels.tsa.arima_model import ARIMA
import matplotlib.pylab as plt
import numpy as np
from statsmodels.tsa.stattools import acf, pacf
import statsmodels.tsa as sm_tsa
import arch

dateparse = lambda dates: pd.datetime.strptime(dates, '%Y-%m')
data = pd.read_csv('AirPassengers.csv', index_col='Month',date_parser=dateparse)
ts = data['#Passengers']

# step 1: 检查平稳性,是否需要差分。 原假设H0:序列为非平稳的,备择假设H1:序列是平稳的
t = adfuller(ts)
print "p-value: ", t[1]
# 其结果是p-value:  0.991880243438,序列是非平稳的,进行差分
ts_diff = ts - ts.shift()
ts_diff.dropna(inplace=True)
t_diff = adfuller(ts_diff)
print "p-value after diff: ", t_diff[1]
# 其结果是p-value after diff:  0.0542132902838,拒绝原假设,序列是平稳的,接下来建立AR(p)模型
# 此处我们直接借用之前的结果ARIMA(2,1,2)
model = ARIMA(ts_diff, order=(2, 1, 2)).fit(disp=-1)

# step 2: ARCH效应检验
# 混成检验(Ljung-Box),检验序列{at^2}的相关性,来判断是否具有ARCH效应, 计算均值方差残差
# 绘制残差以及残差的平方
at = ts_diff -  model.fittedvalues
at2 = np.square(at)
plt.figure(figsize=(10,6))
plt.subplot(211)
plt.plot(at,label = 'at')
plt.legend()
plt.subplot(212)
plt.plot(at2,label='at^2')
plt.legend(loc=0)
plt.show()
# 然后对{at^2}序列进行混成检验: 原假设H0:序列没有相关性,备择假设H1:序列具有相关性
at2.dropna(inplace = True)
m = 25 # 我们检验25个自相关系数
acf,q,p = acf(at2,nlags=m,qstat=True)  ## 计算自相关系数 及p-value
out = np.c_[range(1,26), acf[1:], q, p]
output=pd.DataFrame(out, columns=['lag', "AC", "Q", "P-value"])
output = output.set_index('lag')
print output
# p-value小于显著性水平0.05,我们拒绝原假设,即认为序列具有相关性。因此具有ARCH效应。

# step3: 验证存在ARCH效应,建立ARCH模型
# 先通过{at^2}序列的偏自相关函数PACF来确定ARCH的阶次
lag_pacf = pacf(at2, nlags=30, method='ols')
plt.plot(lag_pacf)
plt.show()
# 大概突破的阶层应该是2,所以波动率模型选择ARCH(2)
train = ts_diff[:-10]
test = ts_diff[-10:]
am = arch.arch_model(train,mean='AR',lags=8,vol='ARCH',p=4)
res = am.fit()
print res.summary()
print res.params

# step 4: 检验拟合的模型
res.hedgehog_plot()
plt.show()


# GARCH(m,s)的定阶较难,一般使用低阶模型如GARCH(1,1),GARCH(2,1),GARCH(1,2)
am2 = arch.arch_model(train, mean='AR', lags=8, vol='GARCH')
res2 = am2.fit()
print res2.summary()
print res2.params
res2.hedgehog_plot()
plt.show()

## 后面则可进行波动率的预测
-
500 Lines or Less Chapter 2: A Continuous Integration System 翻译
什么是持续集成系统?
开发软件时,我们希望能够验证我们的新功能或错误修复是否安全,并如预期的工作。我们通过代码测试来做到这一点。有时,开发人员将在本地运行测试以验证其更改是否安全,但可能没有时间在其软件运行的每个系统上测试代码。此外,越来越多的测试被添加到运行所需的时间,甚至在当地不太可行。因此,建立了持续的集成系统。
连续集成(CI)系统是用于测试新代码的专用系统。在提交到代码存储库时,持续集成系统验证此提交不会中断。为此,系统必须能够获取新的更改,运行测试并报告其结果。像其他系统一样,这是无法抵抗的。意味着如果系统的任何部分发生故障,它应该能够从该点恢复并继续。
这个测试系统还应该很好地处理负载,以便我们可以在合理的时间内获得测试结果,以便在提交速度比测试运行的时间更快的情况下。我们可以通过分发和并行化测试工作来实现这一点。该项目将展示为扩展性设计的小型,裸机分布式连续集成系统。
项目限制和注释
该项目使用Git作为需要测试的代码的存储库。只使用标准的源代码管理,如果你不熟悉Git但熟悉svn或者Mercurial等其他版本控制系统(VCS),你仍然可以参考。
由于代码长度和单元测试的限制,我简化了测试,只运行位于存储库中tests的目录下的测试。
连续集成系统监视通常托管在Web服务器上的主存储库,而不是CI的文件系统本地。对于我们示例的情况,我们将使用本地存储库而不是远程存储库。
持续集成系统不需要按照固定的时间表进行运行。可以运行几个提交或一次提交。我们的例子中CI系统定期运行。这意味着如果设置为检查五秒钟内的更改,将针对五秒钟后提交的内容进行测试。它不会测试在这段时间内做出的所有提交,只有最新的一次。
该CI系统旨在定期检查存储库中的更改。在现实的CI系统中,你还可以通过托管存储库通知存储库观察器。例如,Github提供了发送通知给URL的“post-commit hooks”。遵循这个模型,存储库观察者将被托管在该URL处的Web服务器调用以响应该通知。由于这在本地进行模拟是复杂的,所以我们使用一个观察者模型,其中存储库观察者将检查更改,而不是被通知。
CI系统还有一个report,测试者将其结果报告给可供人们查看的组件,可能在网页上。为简单起见,此项目收集测试结果,并将其作为文件存储在调度程序进程本地的文件系统中。
请注意,CI系统使用的架构只是其中的一种可能性。我们的案例研究使用这种方法简化为三个主要组成部分。
介绍
连续集成系统的基本结构由三个部分组成:an observer, a test job dispatcher, and a test runner。observer观看存储库。当它注意到提交时,它会通知作业调度程序。然后,作业调度程序会找到一个测试运行器,并给出它要进行测试的提交号。
建立CI系统有许多方法。我们可以让observer,dispatcher和runner在单个机器上运行相同的过程。这种方法非常有限,因为没有负载处理,如果更多的更改添加到存储库,会积累大量的积压。这种方法也是不容有错的;如果运行的计算机出现故障或断电,则没有后备系统,因此不会运行测试。理想的系统根据要求处理尽可能多的测试工作的系统,并且将尽力补偿。
为了构建一个容错和负载的CI系统,在这个项目中,每个组件都是独立的。这使每个进程独立于其他进程,并运行每个进程的多个实例。当你有多个测试作业需要同时运行时。然后我们可以并行产生多个测试runners,让我们能够运行尽可能多的工作,并阻止积累的排队测试。
这个项目中,这些组件不仅可作为单独的进程运行,而且还可以通过套接字进行通信,这使我们在单独的联网计算机上运行每个进程。每个组件分配唯一的主机/端口地址,并且每个进程可以通过在分配的地址发布消息来与其他进程通信。
通过启用分布式架构,此设计可即时处理硬件故障。我们可以让observer在一台机器上运行,另一台机器上的测试作业dispatcher ,另一台机器上的测试runner可以通过网络进行通信。如果这些机器中的任何一台机器停机,我们可以安排一台新机器上线,这样系统就会失效。
该项目不包括自动恢复代码,这取决于你的分布式系统的架构,但现实中,CI系统在这样的分布式环境中运行,因此它们可以具有故障转移冗余。
因此,这些过程的每一个将在本地和手动启动不同的本地端口。
此项目中的文件
此项目包含以下每个组件的Python文件:repository observer(
repo_observer.py),the test job dispatcher (dispatcher.py)和 test runner (test_runner.py)。这三个进程中的每一个都使用套接字彼此进行通信,并且由于用于传输信息的代码由所有这些进程共享,所以包含helpers.py文件,因此每个进程导入通信函数。还有这些进程使用的bash脚本文件。这些脚本文件用于通过简单的方式执行bash和git命令,而不是持续使用Python的操作系统级别模块(如os和子进程)。
最后,有一个测试目录,包含CI系统将运行的两个示例测试。一个通过,另一个失败。
初始设置
虽然这个CI系统在分布式系统中工作,但首先在计算机上本地运行一切,这样我们可以掌握CI系统的工作原理,而不增加运行在网络的风险。如果想在分布式环境中运行,可以在自己的机器上运行每个组件。
持续集成系统通过检测代码库中的更改来运行测试,因此起初要设置CI系统将监视的存储库。
调用
test_repo:$ mkdir test_repo $ cd test_repo $ git init这是我们的主存储库。开发人员检查代码的地方,所以我们的CI应该拉这个存储库并检查提交,然后运行测试。repository observer检查新提交的事情。
repository observer通过检查提交工作,因此在主存储库中至少提交一次。
将测试文件夹从该代码库复制到
test_repo并提交:$ cp -r /this/directory/tests /path/to/test_repo/ $ cd /path/to/test\_repo $ git add tests/ $ git commit -m ”add tests”现在在主仓库中有一次提交。
repo observer component需要克隆代码,则可以检测何时进行新的提交。 让我们创建一个我们的主存储库的克隆
test_repo_clone_obs:$ git clone /path/to/test_repo test_repo_clone_obstest runner还需要克隆代码,则可以在给定的提交中检出存储库并运行测试。让我们创建另一个克隆我们的主存储库,并将其称为
test_repo_clone_runner:$ git clone /path/to/test_repo test_repo_clone_runner组件
Repository Observer(
repo_observer.py)repository observer监视存储库,并在看到新的提交时通知调度程序。为了与所有版本控制系统配合使用,这个存储库观察器为定期检查存储库是否有新的提交,而不是依靠VCS来通知已做出更改。
observer定期轮询存储库,当看到更改时,它会告诉调度程序最新的提交ID以对其进行测试。observer通过在存储库中查找当前提交ID来检查新的提交,然后更新存储库,最后,找到最新的提交ID进行比较。observer仅针对最新的提交进行测试。这意味着如果在定期检查之间进行两次提交,观察者将只针对最新的提交运行测试。通常,CI系统检测自上次测试提交以来的所有提交,并将为每个新提交发送测试运行程序,但为简单起见,我修改了这一假设。
observer必须知道要查看哪个存储库。我们以前在
/path/to/test_repo_clone_obs创建了存储库的克隆。观察者使用此克隆来检测更改。为了让repository observer使用这个克隆,我们在调用repo_observer.py文件时传递它。repository observer使用该克隆从主存储库中拉出。我们必须告诉observer调度员的地址,所以observer 可以发送消息。当启动repository observer时,可以使用・–dispatcher-server・命令参数传入调度程序的服务器地址。如果不用,则默认使用
localhost:8888。def poll(): parser = argparse.ArgumentParser() parser.add_argument("--dispatcher-server", help="dispatcher host:port, " \ "by default it uses localhost:8888", default="localhost:8888", action="store") parser.add_argument("repo", metavar="REPO", type=str, help="path to the repository this will observe") args = parser.parse_args() dispatcher_host, dispatcher_port = args.dispatcher_server.split(":")一旦调用repository observer文件,则启动
poll()函数。 此函数解析命令行参数,启动无限while循环。while循环用于定期检查存储库以进行更改。第一件事就是调用update_repo.shBash脚本。while True: try: # call the bash script that will update the repo and check # for changes. If there's a change, it will drop a .commit_id file # with the latest commit in the current working directory subprocess.check_output(["./update_repo.sh", args.repo]) except subprocess.CalledProcessError as e: raise Exception("Could not update and check repository. " + "Reason: %s" % e.output)update_repo.sh文件用于识别新提交,并告知repository observer。通过提交ID,提取存储库并检查最新的提交ID 如果它们匹配,则不进行任何更改,因此存储库观察器不需要执行任何操作,但是如果提交ID有差异,则交了新的提交。这种情况下,update_repo.sh将创建一个名为.commit_id的文件,其中存储最新的提交ID。update_repo.sh的分步如下。首先,run_or_fail.sh脚本,该文件提供了所有shell使用的run_or_fail帮助程序。该方法给出运行命令,或者错误信息。#!/bin/bash source run_or_fail.sh接下来,脚本尝试删除
.commit_id文件。由于updaterepo.sh被repo_observer.py无限调用,如果我们有一个新的提交,则创建.commit_id,但是保存了已经测试过的提交。因此,我们要删除该文件,并且只有在发现新的提交时才创建新文件。bash rm -f .commit_id删除文件后(如果存在),它验证我们正在观察的存储库是否存在,然后将其重置为最近的提交,以防任何导致其失去同步。
run_or_fail "Repository folder not found!" pushd $1 1> /dev/null
run_or_fail "Could not reset git" git reset --hard HEAD
然后调用
git log解析输出,寻找最新的提交ID。COMMIT=$(run_or_fail "Could not call 'git log' on repository" git log -n1) if [ $? != 0 ]; then echo "Could not call 'git log' on repository" exit 1 fi COMMIT_ID=`echo $COMMIT | awk '{ print $2 }'`
-
Time Series Analysis
- prepare data and packages
- Draw data to see the overview
- ADF test for checking the series stable or not
- Make series data Stationary
- Prediction: ARIMA model
- Go back to the origin data
prepare data and packages
Pandas has dedicated libraries for handling TS objects, particularly the datatime64[ns] class which stores time information and allows us to perform some operations really fast. Lets start by firing up the required libraries:
# -*- coding:utf-8 -*-
import pandas as pd
import numpy as np
import matplotlib.pylab as plt
from statsmodels.tsa.stattools import adfuller

from matplotlib.pylab import rcParams
rcParams['figure.figsize'] = 15, 6
from statsmodels.tsa.arima_model import ARIMA
from statsmodels.tsa.seasonal import seasonal_decompose
from statsmodels.tsa.stattools import acf, pacf

# 设置时间格式
dateparse = lambda dates: pd.datetime.strptime(dates, '%Y-%m')
# 读取数据时,见时间设置作为索引
data = pd.read_csv('AirPassengers.csv', index_col='Month',date_parser=dateparse)
ts = data['#Passengers']
Draw data to see the overview
def draw(timeseries):
    rolmean = pd.rolling_mean(timeseries, window=12)
    rolstd = pd.rolling_std(timeseries, window=12)
    orig = plt.plot(timeseries, color='blue', label='Original')
    mean = plt.plot(rolmean, color='red', label='Rolling Mean')
    std = plt.plot(rolstd, color='black', label='Rolling Std')
    plt.legend(loc='best')
    plt.title('Rolling Mean & Standard Deviation')
    plt.show()

plt.plot(ts)
ADF test for checking the series stable or not
# ADF 检验
def test_stationarity(timeseries):
    # Perform Dickey-Fuller test:
    print 'Results of Dickey-Fuller Test:'
    dftest = adfuller(timeseries, autolag='AIC')
    dfoutput = pd.Series(dftest[0:4], index=['Test Statistic', 'p-value', '#Lags Used', 'Number of Observations Used'])
    for key, value in dftest[4].items():
        dfoutput['Critical Value (%s)' % key] = value
    print dfoutput
The result is:
	Results of Dickey-Fuller Test:
	Test Statistic                   0.815369
	p-value                          0.991880
	#Lags Used                      13.000000
	Number of Observations Used    130.000000
	Critical Value (5%)             -2.884042
	Critical Value (1%)             -3.481682
	Critical Value (10%)            -2.578770
	dtype: float64
Note that the signed values should be compared and not the absolute values.
Make series data Stationary
# method 1: One of the first tricks to reduce trend can be transformation.
# 对数变换
ts_log = np.log(ts)

# 移动平均数,原序列去除移动平均,此处使用12个月的平均数
def delMoving_avg(timeseries):
    moving_avg = pd.rolling_mean(timeseries, 12)
    ts_log_moving_avg_diff = timeseries - moving_avg #此处是从12月前开始,没有对前11个月定义,非数字
    ts_log_moving_avg_diff.dropna(inplace=True)
    # ADF 检验
    test_stationarity(ts_log_moving_avg_diff)
    # 绘制移动平均数和去除后的效果图
    plt.subplot(211)
    plt.plot(timeseries)
    plt.plot(moving_avg, color='red')
    plt.subplot(212)
    plt.plot(ts_log_moving_avg_diff)
    plt.show()

# 指数加权移动平均数,原序列去除指数加权移动平均,此处使用12个月的平均数
def delexpMoving_avg(timeseries):
    expwighted_avg = pd.ewma(timeseries, halflife=12)
    ts_log_moving_avg_diff = timeseries - expwighted_avg #此处是从12月前开始,没有对前11个月定义,非数字
    ts_log_moving_avg_diff.dropna(inplace=True)
    # ADF 检验
    test_stationarity(ts_log_moving_avg_diff)
    # 绘制移动平均数和去除后的效果图
    plt.subplot(211)
    plt.plot(timeseries)
    plt.plot(expwighted_avg, color='red')
    plt.subplot(212)
    plt.plot(ts_log_moving_avg_diff)
    plt.show()

# 差分
def delshift(timeseries):
    ts_log_diff = timeseries.shift()
    ts_log_moving_avg_diff = timeseries - ts_log_diff #此处是从12月前开始,没有对前11个月定义,非数字
    ts_log_moving_avg_diff.dropna(inplace=True)
    # ADF 检验
    test_stationarity(ts_log_moving_avg_diff)
    # 绘制移动平均数和去除后的效果图
    plt.subplot(211)
    plt.plot(timeseries)
    plt.plot(ts_log_diff, color='red')
    plt.subplot(212)
    plt.plot(ts_log_moving_avg_diff)
    plt.show()

# method 2: smoothing
delMoving_avg(ts_log)
delexpMoving_avg(ts_log)

# method 3: differences
delshift(ts_log)
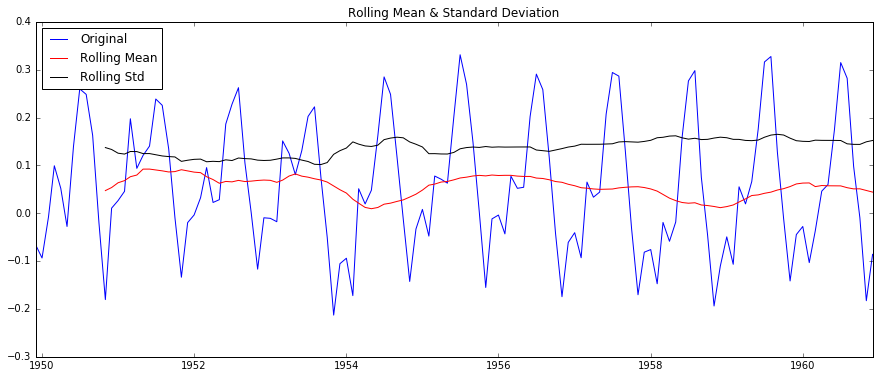
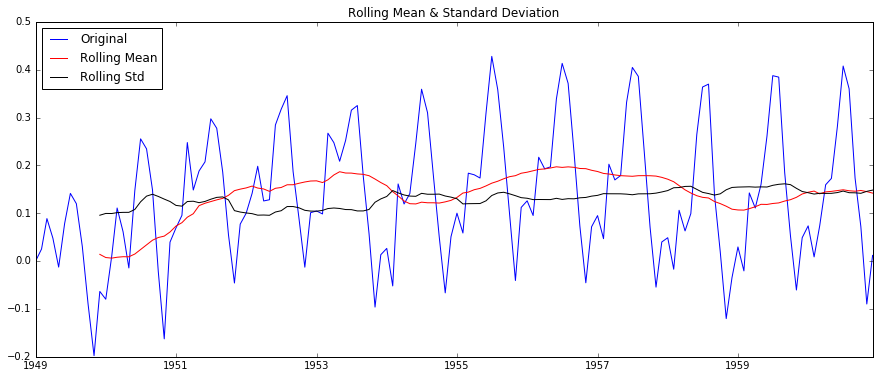
Removing the differences, you can get the images:
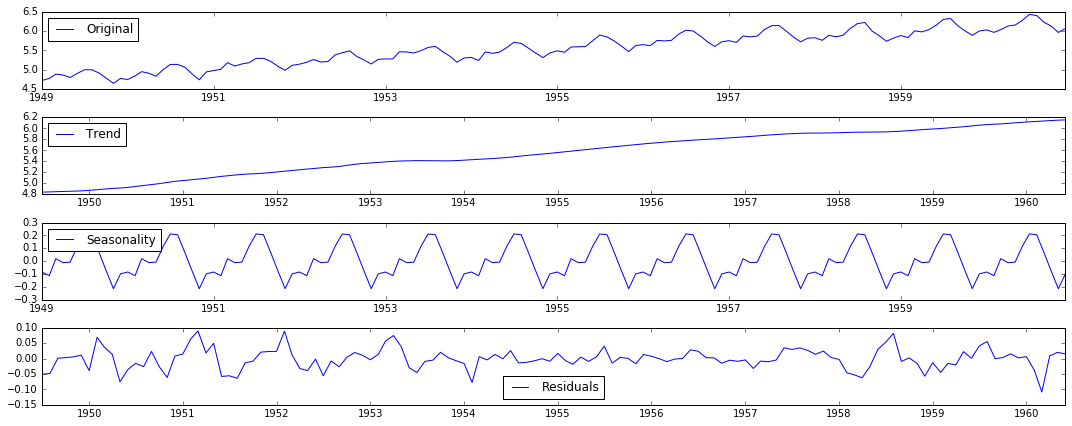
method 4: Decomposition
# 分解
def residuals(timeseries):
    decomposition = seasonal_decompose(timeseries)

    trend = decomposition.trend
    seasonal = decomposition.seasonal
    residual = decomposition.resid

    plt.subplot(411)
    plt.plot(timeseries, label='Original')
    plt.legend(loc='best')
    plt.subplot(412)
    plt.plot(trend, label='Trend')
    plt.legend(loc='best')
    plt.subplot(413)
    plt.plot(seasonal, label='Seasonality')
    plt.legend(loc='best')
    plt.subplot(414)
    plt.plot(residual, label='Residuals')
    plt.legend(loc='best')
    plt.tight_layout()
    plt.show()

    ts_log_decompose = residual
    ts_log_decompose.dropna(inplace=True)
    test_stationarity(ts_log_decompose)
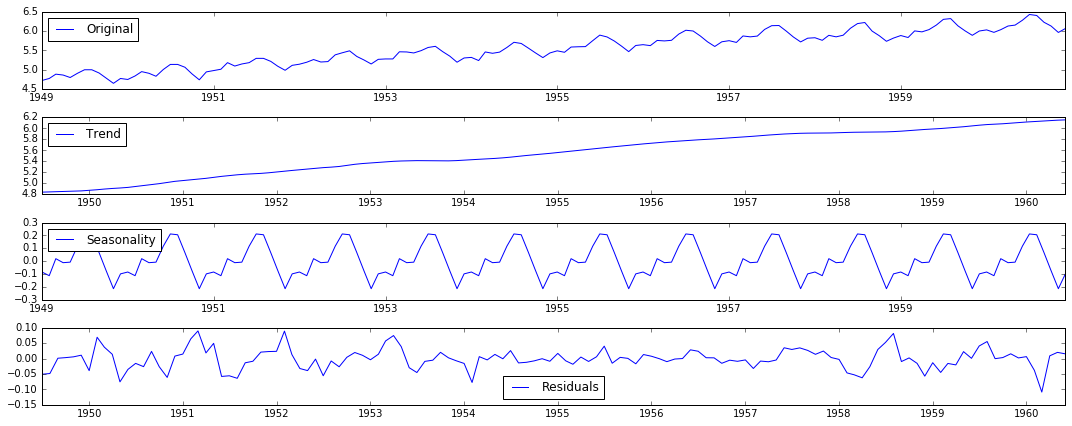
The decomposition diagram
Prediction: ARIMA model
Before the prediction, we have to use ACF and PACF to check the ARIMA parameter p and q.
# 绘制自回归函数确定p值
def plotacf(ts_log_diff):
    lag_acf = acf(ts_log_diff, nlags=20)
    plt.plot(lag_acf, color='red')
    plt.axhline(y=0, linestyle='--', color='gray')
    plt.axhline(y=-1.96 / np.sqrt(len(ts_log_diff)), linestyle='--', color='gray')
    plt.axhline(y=1.96 / np.sqrt(len(ts_log_diff)), linestyle='--', color='gray')
    plt.title('Autocorrelation Function')
    plt.show()

# 绘制部分自回归函数确定q值
def plotpacf(ts_log_diff):
    lag_pacf = pacf(ts_log_diff, nlags=20, method='ols')
    plt.plot(lag_pacf, color='red')
    plt.axhline(y=0, linestyle='--', color='gray')
    plt.axhline(y=-1.96 / np.sqrt(len(ts_log_diff)), linestyle='--', color='gray')
    plt.axhline(y=1.96 / np.sqrt(len(ts_log_diff)), linestyle='--', color='gray')
    plt.title('Autocorrelation Function')
    plt.show()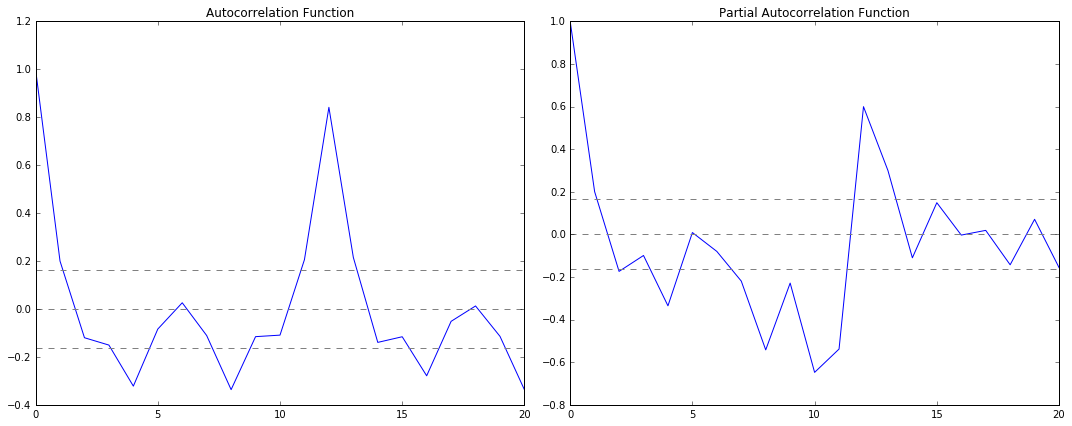
As we can see ,
p – The lag value where the PACF chart crosses the upper confidence interval for the first time. If you notice closely, in this case p=2.
q – The lag value where the ACF chart crosses the upper confidence interval for the first time. If you notice closely, in this case q=2.
Now you can try different AR, MA, ARMA model.
# 绘制ARIMA模型,并计算残差值
def plotARIMA(timeseries, p, d, q):
    model = ARIMA(timeseries, order=(p, d, q))
    ts_log_diff = timeseries - timeseries.shift()
    ts_log_diff.dropna(inplace=True)
    results= model.fit(disp=-1)
    plt.plot(ts_log_diff)
    plt.plot(results.fittedvalues, color='red')
    plt.title('RSS: %.4f' % sum((results.fittedvalues - ts_log_diff) ** 2))
    plt.show()
    return results
Go back to the origin data
# 回到源数据
def backPredict(results_ARIMA, ts_log, ts):
    predictions_ARIMA_diff = pd.Series(results_ARIMA.fittedvalues, copy=True)
    # 计算累计和
    predictions_ARIMA_diff_cumsum = predictions_ARIMA_diff.cumsum()
    predictions_ARIMA_log = pd.Series(ts_log.ix[0], index=ts_log.index)
    predictions_ARIMA_log = predictions_ARIMA_log.add(predictions_ARIMA_diff_cumsum, fill_value=0)
    predictions_ARIMA = np.exp(predictions_ARIMA_log)
    plt.plot(ts)
    plt.plot(predictions_ARIMA)
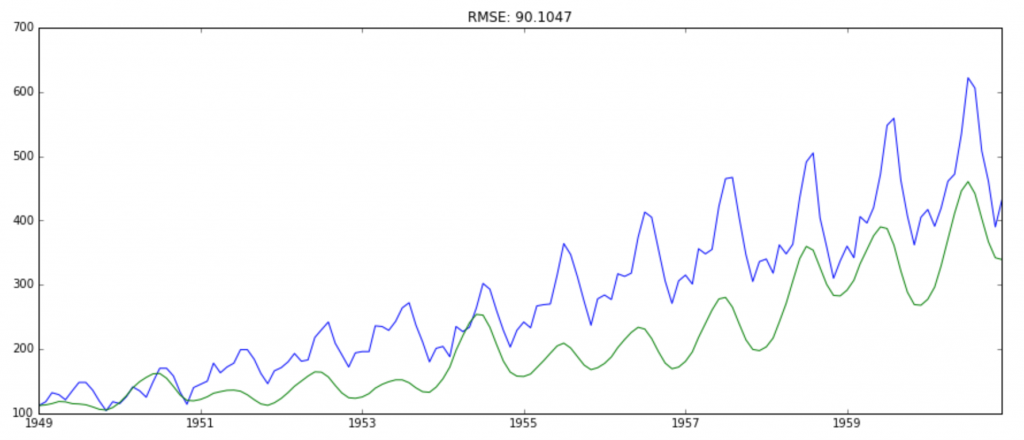
    plt.title('RMSE: %.4f' % np.sqrt(sum((predictions_ARIMA - ts) ** 2) / len(ts)))