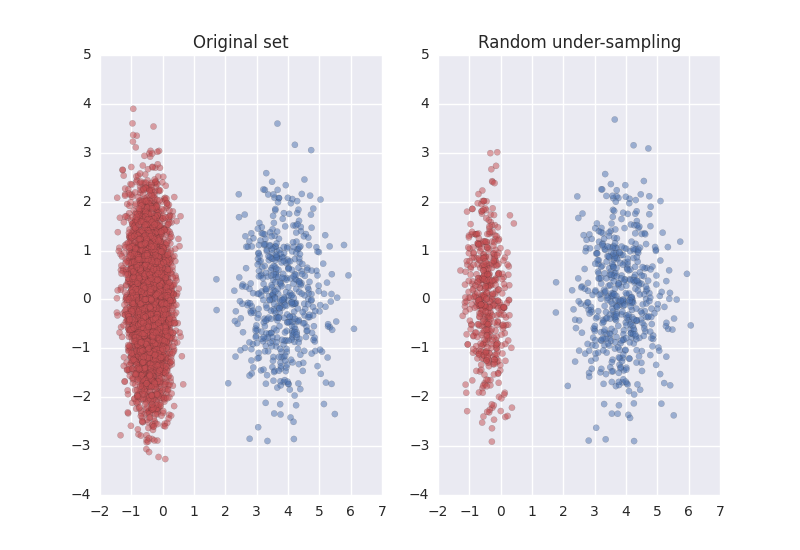
balanced-learn package offers some under-sampling methods:
-
Random majority under-sampling with replacement
-
Extraction of majority-minority Tomek links [1]
-
Under-sampling with Cluster Centroids
-
NearMiss-(1 & 2 & 3) [2]
-
Condensend Nearest Neighbour [3]
-
One-Sided Selection [4]
-
Neighboorhood Cleaning Rule [5]
-
Edited Nearest Neighbours [6]
-
Instance Hardness Threshold [7]
-
Repeated Edited Nearest Neighbours [14]
-
AllKNN [14]
Random under-sample in python
import matplotlib.pyplot as plt
import seaborn as sns
from sklearn.datasets import make_classification
from sklearn.decomposition import PCA

from imblearn.under_sampling import RandomUnderSampler

sns.set()

# Define some color for the plotting
almost_black = '#262626'
palette = sns.color_palette()


# Generate the dataset
X, y = make_classification(n_classes=2, class_sep=2, weights=[0.1, 0.9],
                           n_informative=3, n_redundant=1, flip_y=0,
                           n_features=20, n_clusters_per_class=1,
                           n_samples=5000, random_state=10)

# Instanciate a PCA object for the sake of easy visualisation
pca = PCA(n_components=2)
# Fit and transform x to visualise inside a 2D feature space
X_vis = pca.fit_transform(X)

# Apply the random under-sampling
rus = RandomUnderSampler()
X_resampled, y_resampled = rus.fit_sample(X, y)
X_res_vis = pca.transform(X_resampled)

# Two subplots, unpack the axes array immediately
f, (ax1, ax2) = plt.subplots(1, 2)

ax1.scatter(X_vis[y == 0, 0], X_vis[y == 0, 1], label="Class #0", alpha=0.5,
            edgecolor=almost_black, facecolor=palette[0], linewidth=0.15)
ax1.scatter(X_vis[y == 1, 0], X_vis[y == 1, 1], label="Class #1", alpha=0.5,
            edgecolor=almost_black, facecolor=palette[2], linewidth=0.15)
ax1.set_title('Original set')

ax2.scatter(X_res_vis[y_resampled == 0, 0], X_res_vis[y_resampled == 0, 1],
            label="Class #0", alpha=.5, edgecolor=almost_black,
            facecolor=palette[0], linewidth=0.15)
ax2.scatter(X_res_vis[y_resampled == 1, 0], X_res_vis[y_resampled == 1, 1],
            label="Class #1", alpha=.5, edgecolor=almost_black,
            facecolor=palette[2], linewidth=0.15)
ax2.set_title('Random under-sampling')

plt.show()
