import pandas as pd
import seaborn as sns
import matplotlib.pyplot as plt
from sklearn.utils import check_array
from sklearn.model_selection import train_test_split
from sklearn.linear_model import LinearRegression
from sklearn import metrics
import numpy as np
data = pd.read_csv('http://www-bcf.usc.edu/~gareth/ISL/Advertising.csv', index_col=0)
print data.head()
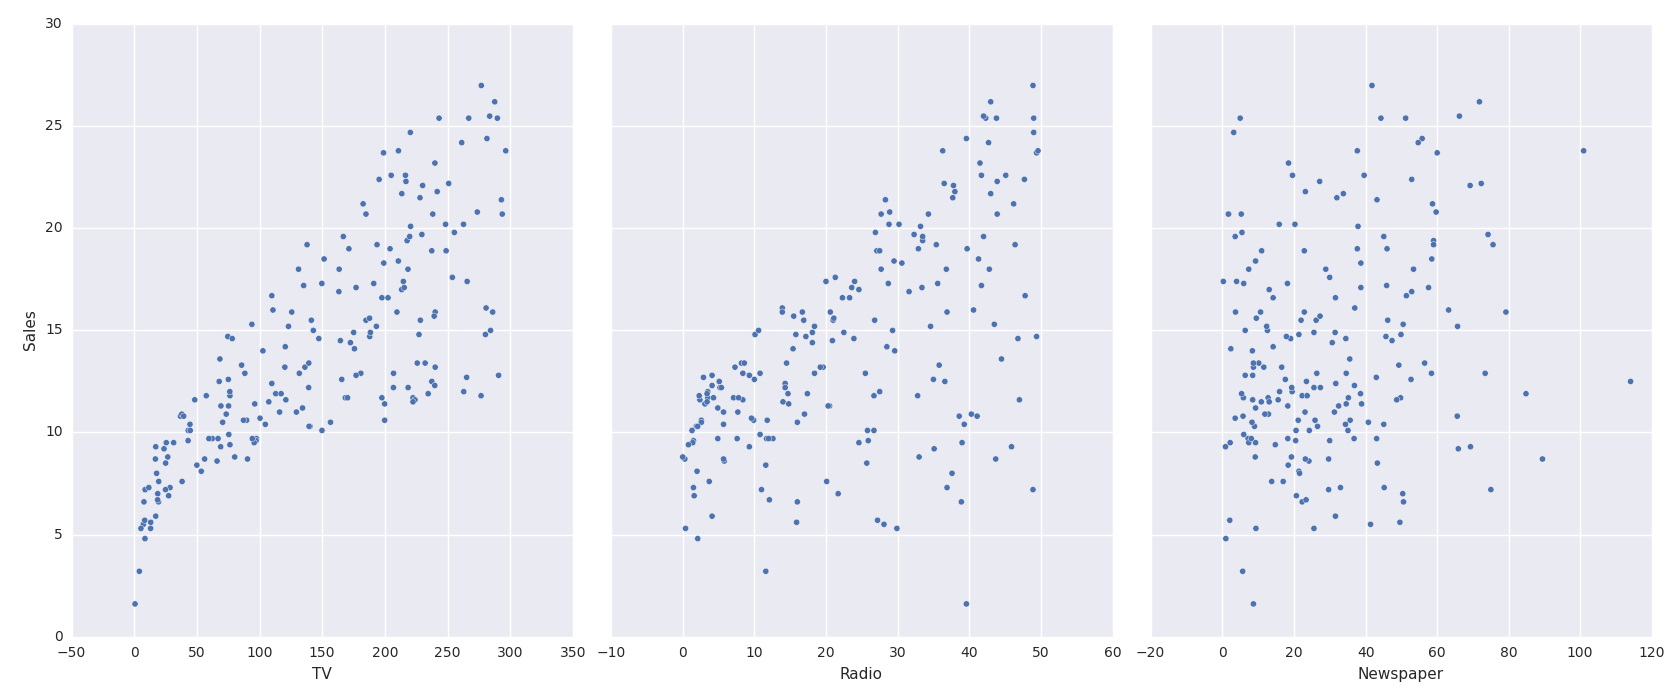
sns.pairplot(data, x_vars=['TV', 'Radio', 'Newspaper'], y_vars='Sales', size=7, aspect=0.8)
plt.show()
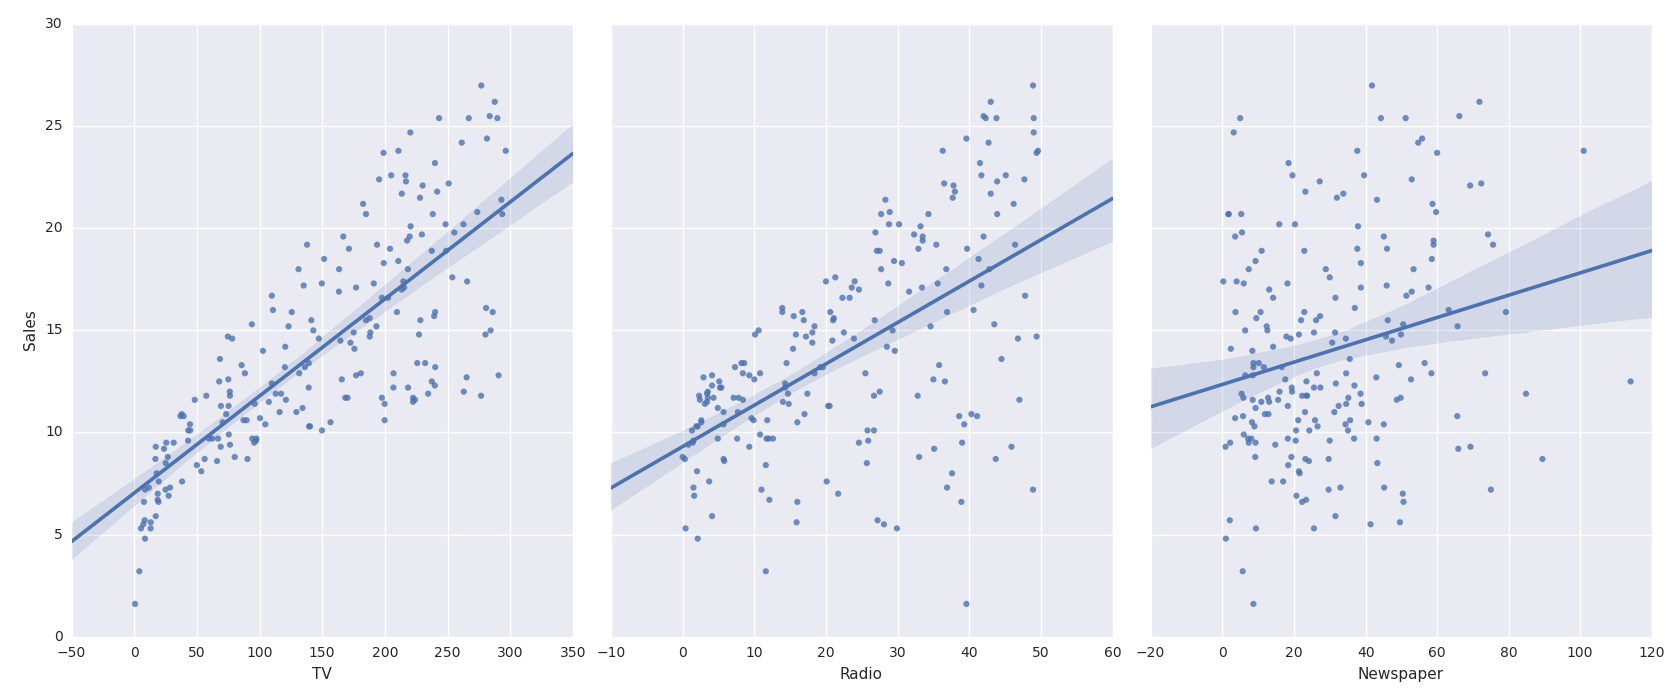
# from the figure, we can see there exits strong linear relationship between TV and sales,
# 'reg' 95%
sns.pairplot(data, x_vars=['TV','Radio','Newspaper'], y_vars='Sales', size=7, aspect=0.8, kind='reg')
plt.show()
# linear regression model
feature_cols = ['TV', 'Radio', 'Newspaper']
x = data[feature_cols]
# check the type and shape
print type(x)
print x.shape
y = data['Sales']
print type(y)
print y.shape
# trainging and test data
x_train, x_test, y_train, y_test = train_test_split(x, y, random_state=1)
linreg = LinearRegression()
linreg.fit(x_train, y_train)
print linreg.intercept_
print linreg.coef_
print zip(feature_cols, linreg.coef_)
y_pred = linreg.predict(x_test)
# evaluate the model
# calculate MAE using scikit-learn, Mean Absolute Error
print "MAE using scikit-learn: ", metrics.mean_absolute_error(y_test, y_pred)
# calculate MSE using scikit-learn, Mean Squared Error
print "MSE using scikit-learn", metrics.mean_squared_error(y_test, y_pred)
# calculate RMSE using scikit-learn, Root Mean Squared Error
print "RMSE:",np.sqrt(metrics.mean_squared_error(y_test, y_pred))
# as we can see newspaper is weak-relationship with Sales, so remove the feature
feature_cols = ['TV', 'Radio']
x = data[feature_cols]
y = data.Sales
x_train, x_test, y_train, y_test = train_test_split(x, y, random_state=1)
linreg.fit(x_train, y_train)
y_pred = linreg.predict(x_test)
print np.sqrt(metrics.mean_squared_error(y_test, y_pred))
Scatter Figure
 Linear Regression Figure