Data mining is a complex process that aims to discover patterns in large data sets. Data Mining some main steps:
-
Collect data: based on the needs
-
Pre-Processing: try to understand the data, denoise and do some dimentation reduction and select the proper predictors, etc
-
Feeding data mining
-
Post-Processing: interpret and evaluate the models
Loading datasets in Python
import pandas as pd
csv_path = 'python_code/data/Heart.csv'
rawdata = pd.read_csv(csv_path)
excel_path = 'python_code/data/energy_efficiency.xlsx'
raw_data2 = pd.read_excel(excel_path)
Understand data with statistics
print "data summary"
print rawdata.describe()
Then you will get
	                 id        year       stint           g          ab
	count    100.000000   100.00000  100.000000  100.000000  100.000000
	mean   89352.660000  2006.92000    1.130000   52.380000  136.540000
	std      218.910859     0.27266    0.337998   48.031299  181.936853
	min    88641.000000  2006.00000    1.000000    1.000000    0.000000
	25%    89353.500000  2007.00000    1.000000    9.500000    2.000000
	50%    89399.000000  2007.00000    1.000000   33.000000   40.500000
	75%    89465.250000  2007.00000    1.000000   83.250000  243.750000
	max    89534.000000  2007.00000    2.000000  155.000000  586.000000
Get the size of the data
nrow, ncol = rawdata.shape
print nrow, ncol
Check the data format
print rawdata.dtypes
Then you will get
	id          int64
	player     object
	year        int64
	stint       int64
	team       object
	lg         object
	g           int64
	ab          int64
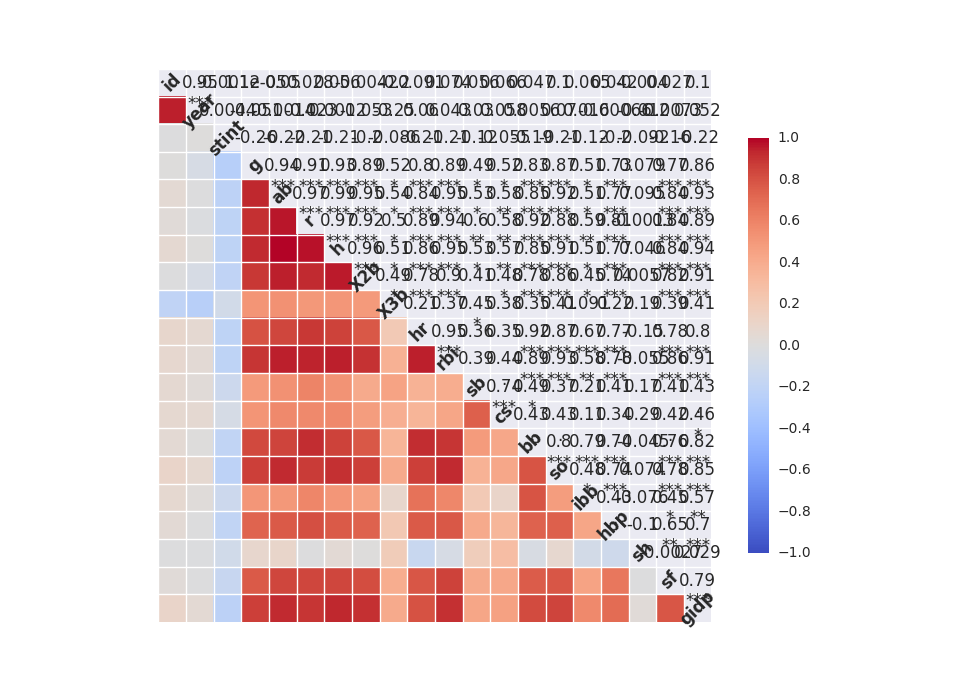
Get correlation matrix and covariance matrix
# correlation matrix
print "\n correlation Matrix"
print rawdata.corr()
# covariance Matrix
print "\n covariance Matrix"
print rawdata.corr()
Understand data with visualization
from scipy import stats
import seaborn as sns
sns.corrplot(rawdata)
plt.show()
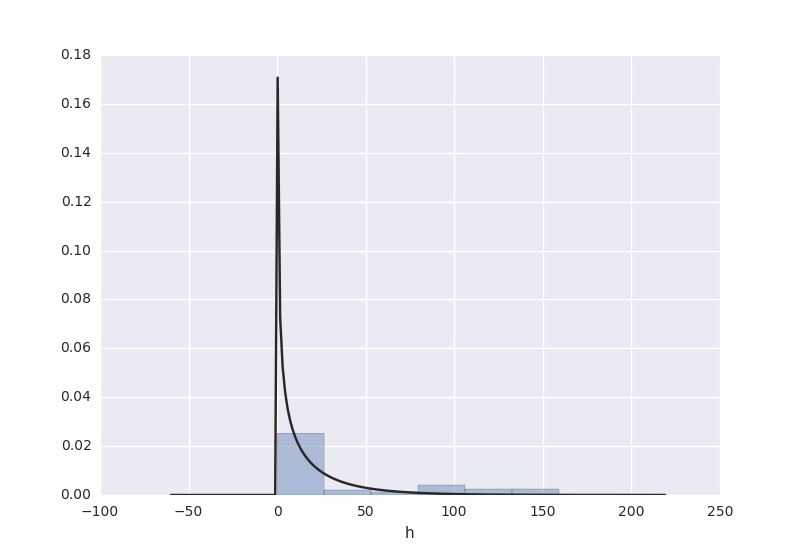
# plot a distribution of observations
attr = rawdata['h']
sns.distplot(attr, kde=False, fit=stats.gamma)
plt.show()
# two subplots, histogram
plt.figure(1)
plt.title("Histogram of stint")
plt.subplot(211) # 2 rows, 1 col
plt.subplot(212) # 2 rows, 1 col
sns.distplot(attr, kde=False, fit=stats.gamma)
plt.show()